This chapter provides an overview of CITES trade in the Region, with a summary of the CITES-listed species occurring in the Region. The trade analysis focuses on the number of trade transactions over time (including breakdown by source), the main trading partners, and trade by taxonomic group for direct exports and imports. Details on the most commonly traded commodities by taxonomic group are also provided.
Number of CITES-listed species
Approximately 1880 taxa (560 animals and >1320 plants) from 110 families are native to the Region and included within the CITES Appendices (source: Species+; orchid data are incomplete). Of these, 65 taxa are listed in Appendix I, 1790 in Appendix II and 33 in Appendix III (four of which have populations listed in both Appendix I and II). Birds account for 40% of CITES-listed animals that naturally occur in this region (Figure 1.1), while the majority of CITES-listed plant taxa are orchids (Figure 1.2). Of the seven countries in the Region, Costa Rica has the greatest number of CITES-listed taxa occurring within its borders (Figure 1.3).
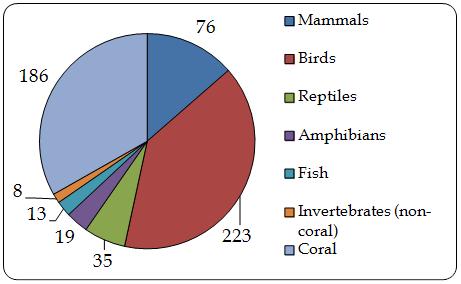
Figure 1.1. Number of CITES-listed animal species occurring in the Region, by taxonomic group. Source: Species+.

Figure 1.2. Number of CITES-listed plant species occurring in the Region, by family. Orchid data are incomplete. Source: Species+
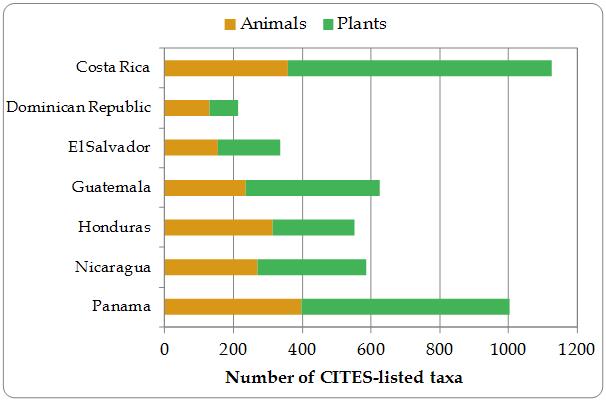
Figure 1.3. Number of CITES-listed taxa in the Region, by country. Orchid data are incomplete. Source: Species+ (www.speciesplus.net).
Exports from the Region
The Region is predominantly an exporter of CITES-listed species, with direct export transactions outnumbering direct import transactions by approximately six to one over the period 2003-2012. In total, 29,123 direct export transactions were reported by countries in the Region in their annual reports to CITES. Over the same period, their trading partners recorded 20% fewer import transactions from the Region (23,220 transactions). The number of direct export transactions peaked in 2007 with 3918 transactions and, while variable, decreased between 2007 and 2012; transactions recorded by trading partners remained relatively constant over the ten year period (Figure 1.4). Based on the number of reported transactions, Costa Rica was the main exporter in the Region, accounting for 46% and 33% of direct export transactions based on exporter- and importer-reported data, respectively (Figure 1.5).
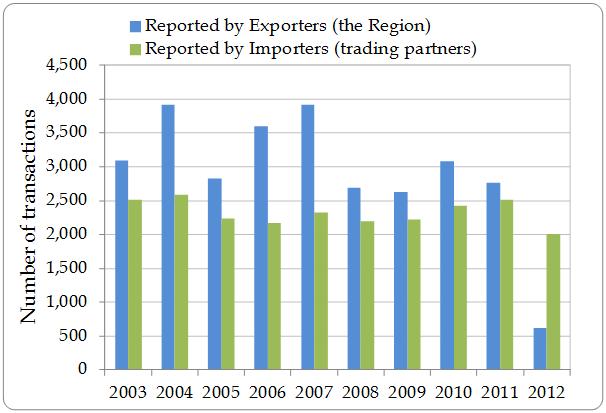
Figure 1.4. Number of direct export transactions as reported by countries of export in the Region and by importers (trading partners), 2003-2012.
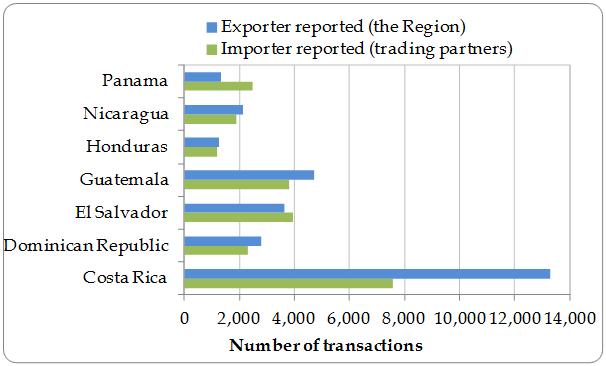
Figure 1.5. Number of direct export transactions by exporting country, as reported by exporters (the Region) and importers (trading partners), 2003-2012.
Of the exporter-reported transactions, the majority (81%) comprised artificially propagated (65%) or captive-bred (source C) (16%) commodities, with 16% comprising wild-sourced commodities (Figure 1.6). According to importer-reported data, 57% of transactions comprised artificially propagated commodities, 21% captive-bred (source C) and 17% wild-sourced.
The proportion of wild-sourced transactions decreased every year 2008-2010, reaching its lowest level over the ten year period in 2010; conversely, the proportion of captive-bred/artificially-propagated transactions increased 2003-2011. Shifts in source over time are discussed further in Chapter III. The majority of direct export transactions reported by the Region (91%) involved trade for commercial purposes (Figure 1.7).
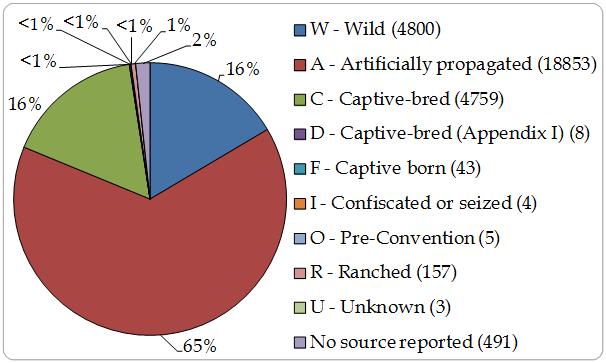
Figure 1.6. Proportion and number of direct export transactions from the Region by Source as reported by exporters, 2003-2012 (n=29,123).
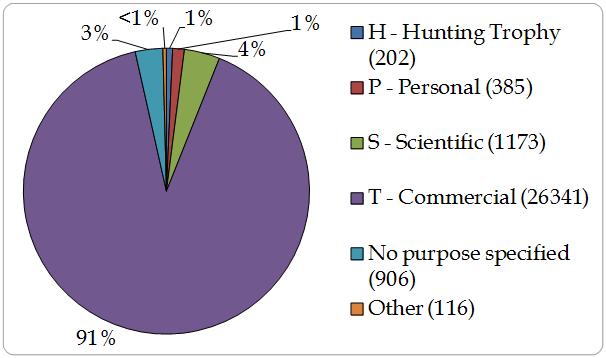
Figure 1.7. Proportion and number of direct export transactions from the Region by Purpose as reported by exporters, 2003-2012 (n=29,123). ‘Other’ includes purpose codes ‘B’, ‘E’, ‘G’, ‘L’, ‘Q’ and ‘Z’.
A breakdown of trade by country is presented in Table 1.1. In the case of Costa Rica, the Dominican Republic and Guatemala, more than 50% of export transactions comprised artificially propagated plants; 97% of export transactions from El Salvador comprised captive-bred reptiles (Table 1.1). The top five animals and plants exported by each country (on the basis of quantity) are also provided within the table; again, the majority of exports are in captive-bred and artificially propagated specimens. For wild-sourced trade, five animal species (Strombus gigas, Boa constrictor, Meleagris ocellata, Montastrea annularis, and Caiman crocodilus fuscus) and two plant species (Swietenia macrophylla and Cedrela odorata) recorded in trade as source ‘W’ emerge within the top five of at least one country and are traded at levels in excess of 100 units (all terms/units considered). Species showing noteworthy patterns of trade are explored in more detail in Chapter II. With the exception of Honduras, all countries in the Region reported the United States as the top destination for export transactions; in the case of Honduras this was the Netherlands.
Table 1.1a. Overview of exports by the Region, by country, as reported by exporters (the Region), 2003-2012.
| Country | Number of export transactions | Main exports (% of transactions) | Main trading partner for exports (% of transactions) |
|---|---|---|---|
| Costa Rica | 13,277 | artificially propagated plants (96%) | United States (44%) |
| Dominican Republic | 2804 | artificially propagated plants (97%) | United States (76%) |
| El Salvador | 3634 | captive-bred reptiles (97%) | United States (33%) |
| Guatemala | 4697 | artificially propagated plants (55%) | United States (43%) |
| Honduras | 1254 | artificially propagated plants (49%) | Netherlands (48%) |
| Nicaragua | 2115 | wild sourced reptiles (43%) | United States (59%) |
| Panama | 1342 | captive-bred reptiles (27%) | United States (42%) |
Table 1.1b. Overview of exports by the Region, by country, as reported by exporters (the Region), 2003-2012.
| Country | Top 5 animal taxa exported based on quantities (main term and source)* | Top 5 plant taxa exported based on quantities (main term and source)* |
|---|---|---|
| Costa Rica | Boa constrictor (697 live, C) | Cycas revoluta (26,045,311 leaves, A) |
| Agapornis roseivollis (225 live, C) | Phalaenopsis spp. (5,118,164 live, A) | |
| Epicrates maurus (113 live, C) | Cycas thouarsii (919,585 leaves, A) | |
| Corallus annulatus (76 live, C) | Zamia furfuracea (826,099 live, A) | |
| Agapornis personatus (50 live, C) | Euphorbia abyssinica (600,887 live, A) | |
| Dominican Republic | Strombus gigas (52,768 kg meat, W) | Cycas revoluta (5,645,431 live A) |
| Cyclura cornuta (100 live, C) | Echinocactus grusonii (1,075,361 live, A) | |
| Tyto alba (25 feathers, C) | Euphorbia lactea (906,650 live, A) | |
| Athene cunicularia (10 feathers, C) | Cereus repandus (579,694 live, A) | |
| Cyclura ricordi (8 specimens, W) | Phalaenopsis spp. (438,798 live, A) | |
| El Salvador | Iguana iguana (3,935,434 live, C) | Cycas revoluta (48,000 live, no source reported) |
| Stigmochelys pardalis (33,595 live, C) | ||
| Geochelone sulcata (9493 live, C) | ||
| Boa constrictor (5945 live, C) | ||
| Chamaeleo calyptratus (3877 live, C) | ||
| Guatemala | Iguana iguana (79,060 live, C) | Cycas revoluta (2,785,648live, A) |
| Caiman crocodilus fuscus (470 live, C) | Tillandsia xerographica (1,376,438 live, A) | |
| Melagris ocellata (175 trophies, W) | Tillandsia harrisii (1,198,209 live, A) | |
| Lepidochelys olivacea (140 specimens, W) | Zamia furfuracea (346,087 live, A) | |
| Ateles geoffroyi (41 live, C) | Schlumbergera spp. (181,500 live, A) | |
| Honduras | Strombus gigas (1,420,380 kg meat, W) | Cycas revoluta (2,257,952 live, A) |
| Boa constrictor (4262 live, W) | Swietenia spp (70,818 kg timber, no source reported) | |
| Crocodylus acutus (940 skins, no source reported) | Neodypsis decaryi (16,000 live, A) | |
| Alligatoridae spp. (1029 kg skins, no source reported) | Zamia furfuracea (14,000 live, A) | |
| Montastrea annularis (472 live, W) | Swietenia macrophylla (7102 carvings, no source reported) | |
| Nicaragua | Strombus gigas (806,114 kg meat, W) | Swietenia macrophylla (24,652 m3 timber, W) |
| Caiman crocodilus fuscus (37,736 small leather products, W) | Cedrela odorata (201 m3 timber, W) | |
| Boa constrictor (37,404 live, C) | Dipteryx panamensis (45 m3 timber, W) | |
| Iguana iguana (8607 live, C) | - | |
| Amazona autumnalis (1534 live, R) | - | |
| Panama | Caiman crocodilus fuscus (227,824 skin pieces, C) | Orchidaceae spp. (26,525 live, A) |
| Dendrobates auratus (40,831 live, C) | Orchidaceae hybrid (6671 live, A) | |
| Caiman crocodilus (28,478 skin pieces, C) | Swietenia macrophylla (280 m3 timber, A) | |
| Oophaga pumilio (20,935 live, C) | Zamia spp. (239 live, A) | |
| Anura spp. (10,130 live, C). | Vanda spp. (201 live, A) |
Main trading partners
Based on the number of direct export transactions as recorded by the seven countries within the Region, the majority of trade (56%) was to North America, followed by Europe (32%; Figure 1.8). Exports to the United States alone accounted for 48% of total transactions reported (Table 1.2).
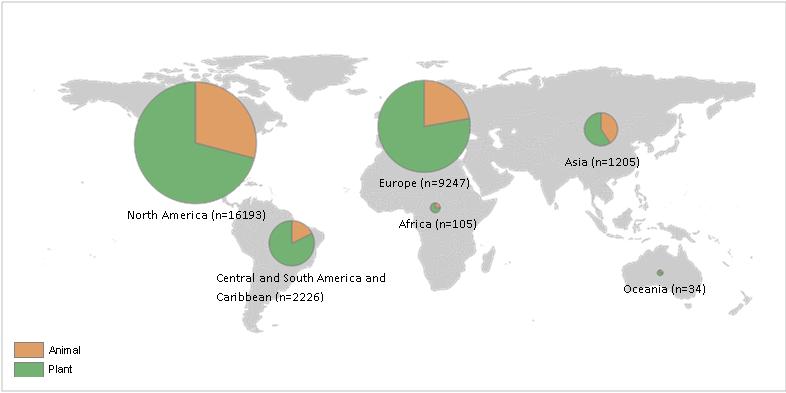
Figure 1.8. Destination of reported direct export transactions from the Region, by CITES Region and by Kingdom, 2003-2012. 113 transactions were reported without a specified destination country.
Table 1.2. Top 10 destination countries of direct export transactions from the Region, reported by exporters (the Region) and importers (trading partners), 2003-2012.
| Reported by Exporters (the Region) | Reported by Importers (trading partners) | |||
|---|---|---|---|---|
| Importer | # transactions (% of total) | Importer | # transactions (% of total) | |
| United States* | 14045 (48%) | United States | 11540 (50%) | |
| Netherlands | 4773 (16%) | Netherlands | 4468 (19%) | |
| Canada | 1638 (6%) | Spain | 1375 (6%) | |
| Spain | 1529 (5%) | Germany | 1195 (5%) | |
| Mexico | 924 (3%) | Mexico | 1046 (5%) | |
| Germany | 687 (2%) | Japan | 488 (2%) | |
| Poland | 515 (2%) | Italy | 322 (1%) | |
| Japan | 424 (1%) | France | 222 (1%) | |
| Italy | 420 (1%) | Dominican Republic | 204 (1%) | |
| Dominican Republic | 397 (1%) | Ecuador | 174 (1%) |
Trade by taxonomic group
Plant commodities were the most highly traded items, accounting for 66% of direct export transactions (Figure 1.9). When quantities are analysed, the most highly traded commodities were live plants (~42.5 million individuals), leaves (~27 million), live reptiles (~4 million) and invertebrate meat (~2.7 million kg; Table 1.3). Of the top five taxon/term combinations exported by the Region, three were plants (Box 1.1). Cycas revoluta leaves were the highest traded commodity according to exporter reported data, with over 26 million leaves directly exported 2003-2012. Of all wild-sourced exports, Strombus gigas meat was the top commodity in trade, with exporter-reported quantities of over two million kg. Importer-reported data showed similar patterns to exporter-reported data in terms of the top bird, reptile, amphibian and plant commodities exported (Table 1.4).
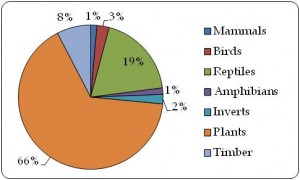
Figure 1.9. Direct export transactions from the Region by taxonomic group, 2003-2012 (n= 29,123).
| Cycas revoluta (leaves) | 26,075,406 |
| Cycas revoluta (live) | 25,648,680 |
| Phalaenopsis spp. (live) | 5,564,074 |
| Iguana iguana (live) | 4,024,957 |
| Strombus gigas (meat, kg) | 2,757,660 |
Table 1.3. Top commodities (on the basis of quantities in trade) within each taxonomic group directly exported by the Region, as reported by exporters, by source, 2003-2012. Trade for scientific purposes (purpose S) was excluded. No direct exports of fish were reported 2003-2012. Figures rounded to nearest whole number, where applicable.
| Group | Term | Quantity | Main importer | Main exporter | % Wild- sourced | % source U or no source specified | % sources C, or A | % other sources | Top taxon |
|---|---|---|---|---|---|---|---|---|---|
| Mammals | live* | 294 | Unknown (20%) | Guatemala (47%) | 2% | 21% | 72% C | 3% R; 2% F; <1% I[/r] | Callithrix pygmaea (Pygmy Marmoset) |
| Birds | live | 5689 | Italy (21%) | Nicaragua (90%) | 13% | 1% | 8% C | 78% R; <1% F[/r] | Amazona autumnalis(Red-lored Amazon) |
| Reptiles | live | 4,131,999 | United States (47%) | El Salvador (97%) | <1%[/r] | 0% | >99% C | <0.1% R[/r] | Iguana iguana (Green Iguana) |
| Amphibians | live | 91,164 | United States (69%) | Panama (100%) | <1%[/r] | 20% | 80% C | Dendrobates auratus (Green Poison Frog) | |
| Invertebrates | meat (kg) | 2,757,660 | United States (94%) | Honduras (68%) | 83% | 15% | 3% C | Strombus gigas (Queen Conch) | |
| Plants (non timber) | live | 42,465,105 | United States (52%) | Costa Rica (55%) | 0% | 1% | 99% A | Cycas revoluta | |
| Timber | timber (m3) | 79,061 | United States (62%) | Guatemala (67%) | >99% | <1%[/r] | <1% A[/r] | Swietenia macrophylla (Big-leaf Mahogany) |
Table 1.4. Top commodities (on the basis of quantities in trade) within each taxonomic group directly exported by the Region, as reported by importers (trading partners), by source, 2003-2012. Trade for scientific purposes (purpose S) was excluded. Figures rounded to nearest whole number, where applicable.
| Group | Term | Quantity | Main importer | Main exporter | % Wild- sourced | % source U or no source specified | % sources C, or A | % other sources | Top taxon |
|---|---|---|---|---|---|---|---|---|---|
| Mammals | Carvings | 1934 | United States (>99%) | Dominican Republic (100%) | 0% | 99% | 0% | 1% O; <1% I | Cetacea spp. (whales & dolphins) |
| Birds | Live | 6826 | Nether-lands (24%) | Nicaragua (92%) | 17% | <1%[/r] | 75% R | 7% C; <1% I; <1% F[/r] | Amazona autumnalis (Red-Lored Amazon) |
| Reptiles | live | 3,790,594 | United States (43%) | El Salvador (96%) | 1% | 0% | 98% C | <1% other[/r] | Iguana iguana (Green Iguana) |
| Amphibians | Live | 153,064 | United States (80%) | Panama (61%) | 2% | 0% | 96% C | 1% I; <1% R[/r] | Agalychnis callidryas* (Red-eyed Leaf frog) |
| Fish | Bodies | 9 | United States (78%) | Panama (78%) | 0% | 0% | 0% | 100% I | Hippocampus spp. (Seahorses) |
| Invertebrates | meat (kg) | 4,137,237 | United States (99%) | Honduras (46%) | 99% | 0% | <1% C[/r] | 1%I; <0.1% R[/r] | Strombus gigas (Queen Conch) |
| Plants (non-timber) | Live | 33,155,547 | United States (57%) | Costa Rica (49%) | 0% | 0% | >99% A | <0.1% I; <0.1% R[/r] | Cycas revoluta |
| Timber | timber (kg) | 151,446 | China (66%) | Panama (100%) | 19% | 0% | 0%*** | 66% O; 15% I | Dalbergia retusa |
Imports to the Region
Countries in the Region reported a total of 5367 direct import transactions over the period 2003-2012, with a peak in 2010 (Figure 1.10). Based on direct import data reported by the Region, the main importing country was the Dominican Republic, accounting for 56% of transactions; according to trading partner data, Panama was the main importer (32% of transactions) (Figure 1.11).
Direct import transactions mainly comprised artificially-propagated (54%), wild-sourced (22%) and captive-bred commodities (12%) (Figure 1.12). The proportion of wild-sourced import transactions increased from 5% in 2003 to a peak of 49% in 2008, remaining at less than 15% in subsequent years. Artificially propagated import transactions increased from 18% in 2003 to 86% in 2012, while captive-bred import transactions decreased from 48% in 2003 to an average of 9% between 2008 and 2012. The majority of direct import transactions reported by the Region involved trade for commercial purposes (85%) (Figure 1.13).
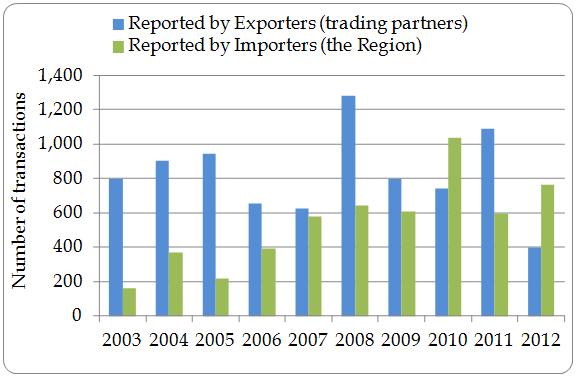
Figure 1.10. Number of direct import transactions to the Region, as reported by exporters (trading partners) and importers (the Region), 2003-2012.
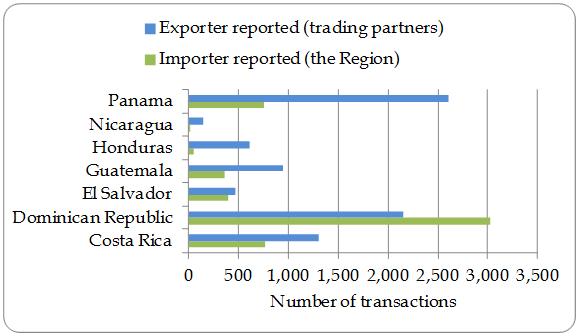
Figure 1.11. Number of direct import transactions to the Region by importing country, as reported by exporters (trading partners) and importers (the Region), 2003-2012.
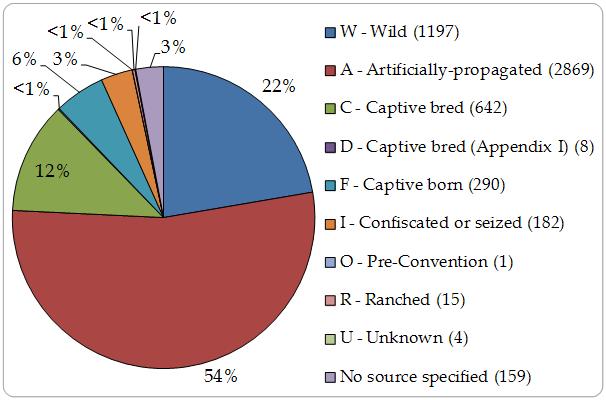
Figure 1.12. Proportion and number of direct import transactions to the Region by source, as reported by importers, 2003-2012 (n=5367).

Figure 1.13. Proportion and number of direct import transactions to the Region by purpose, as reported by importers 2003-2012 (n=5367). ‘Other’ includes purpose ‘B’, ‘E’ and ‘H’.
Main trading partners
The majority of imports by the Region (30% of transactions reported by importers) originated in Asia (CITES Region 2). According to exporter-reported data, however, 44% of transactions originated in other countries within Central and South America and the Caribbean (CITES Region 3). Based on import data from the Region, Thailand was the main exporting country (accounting for 23% of import transactions); the United States was the main exporting country according to trading partners (accounting for 25% of export transactions) (Table 1.5).
Table 1.5. Top ten origin countries of direct import transactions to the Region, reported by exporters (trading partners) and importers (the Region), 2003-2012.
| Reported by Exporters (trading partners) | Reported by Importers (the Region) | |||
|---|---|---|---|---|
| Exporter | # transactions (%) | Exporter | # transactions (%) | |
| United States | 2086 (25%) | Thailand | 1246 (23%) | |
| Thailand | 965 (12%) | Fiji | 1026 (19%) | |
| Cuba | 681 (8%) | United States | 957 (18%) | |
| Guatemala | 488 (6%) | Cuba | 289 (5%) | |
| Peru | 431 (5%) | Taiwan, Province of China | 252 (5%) | |
| Canada | 419 (5%) | Guatemala | 190 (4%) | |
| Costa Rica | 349 (4%) | Unknown | 185 (3%) | |
| Germany | 344 (4%) | Panama | 126 (2%) | |
| Ecuador | 337 (4%) | Peru | 123 (2%) | |
| Nicaragua | 251 (3%) | Suriname | 115 (2%) |
Trade by taxonomic group
Import transactions mainly comprised plant (40%), timber (27%) and bird (18%) commodities (Figure 1.14). The most highly traded commodities (based on quantities) were live plants, timber (reported in m3) and reptile skins (Table 1.6).
All top five taxon/term combinations imported by the Region were plants (Box 1.2). Of all wild-sourced imports, Swietenia macrophylla timber was the most highly imported commodity (339,673 m3), followed by Antipathes densa raw coral (51 198), as reported by importers; trade in the latter was not reported by the exporter (Taiwan, Province of China).[1]
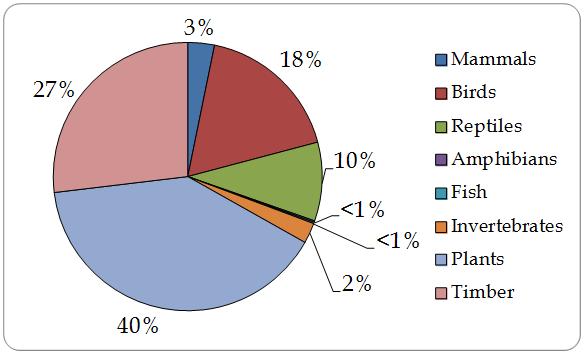
Figure 1.14. Direct import transactions to the Region by taxonomic group, 2003-2012 (n=5367).
| Dendrobium spp. (live) | 720,703 |
| Dendrobium hybrid (live) | 660,812 |
| Sweitenia macrophylla (timber, m3) | 387,305 |
| Phalaenopsis hybrid (live) | 360,813 |
| Phalaenopsis spp. (live) | 358,021 |
Table 1.6. Top commodities (on the basis of quantities in trade) within each taxonomic group directly imported by the Region, as reported by importers, by source*, 2003-2012. Trade for scientific purposes (purpose S) was excluded. Figures rounded to the nearest whole number, where applicable.
| Group | Term | Quantity | Main importer | Main exporter | % wild-sourced | % source U or no source specified | % captive-produced | % other sources | Top taxon |
|---|---|---|---|---|---|---|---|---|---|
| Mammals | live | 662 | Dominican Republic (64%) | Suriname (37%) | 62% | 13% | 13% C | 8% I; 4% F | Saimiri sciureus (Common Squirrel Monkey) |
| Birds | live | 25,693 | Panama (46%) | Cuba (85%) | 5% | 2% | 88% C | 4% F; 1% I; <0.1% R; <0.1% D[/r] | Agapornis roseicollis** (Peach-faced Lovebird) |
| Reptiles | skins | 102,245 | Panama (99%) | Argentina (56%) | 67% | 13% | 20% C | <1% D[/r] | Tupinambis rufescens (Red Tegu) |
| Amphibians | live | 30 | Guatemala (100%) | Canada (97%) | 0% | 0% | 100% C | Dendrobates tinctorius (Dyeing Poison Frog) | |
| Fish | caviar | 10,000 | Panama (100%) | Uruguay (100%) | 0% | 0% | 100% C | Acipenser baerii (Siberian sturgeon) | |
| Invertebrates | raw corals | 51,208 | Dominican Republic (>99%) | Taiwan, POC (>99%) | >99% | <1%[/r] | 0% | Antipathes densa | |
| Plants (non timber) | live | 2,956,269 | Dominican Republic (76%) | Thailand (67%) | <1%[/r] | <1%[/r] | >99% A | Dendrobium spp. | |
| Timber | timber (m3) | 391,523 | Dominican Republic (>99%) | Fiji (88%) | 88% | <1%[/r] | 12% A | Swietenia macrophylla (Big-leaf Mahogany) |
[1]The annual reports of China do not include data on the trade of Taiwan, Province of China.
Conclusions
The Region can be characterised as primarily exporters with 29,123 direct export transactions reported over the period 2003-2012. Artificially-propagated plants accounted for over half of all direct export transactions from the Region; reptile commodities, the majority of which were captive-bred skins, also accounted for a large proportion of transactions. Top commodities exported by the Region included live Cycas revoluta, live Iguana iguana and Strombus gigas meat. The United States was the top importer of trade from the Region, reported as the importer for 48% of direct export transactions. A total of 5367 direct import transactions were reported by the Region, of which 53% comprised artificially-propagated plants. Top commodities imported by the Region included live orchids and Swietenia macrophylla timber.