This chapter examines trends in direct exports from the Region over the ten-year period 2003-2012, focusing on shifts in the source of trade by taxonomic group and in particular species, as well as overall shifts in trade levels in particular species and higher taxa.
Overall transactions
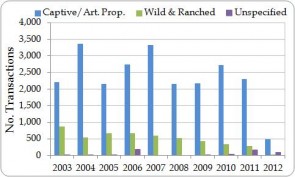
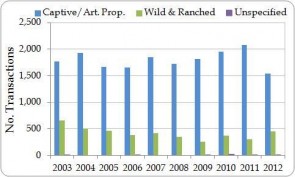
When the total number of individual trade transactions are analysed, captive-bred, captive-born and artificially propagated trade accounts for an average of 81% of transactions per year (according to both exporter- and importer-reported data), while wild-sourced and ranched trade accounts for an average of 16% of transactions per year according to exporter-reported data and 19% according to importer-reported data (Figures 3.1 and 3.2).
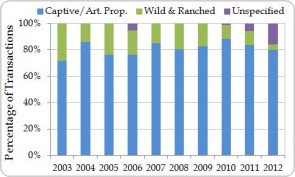
Figure 3.1. Proportion of exporter-reported direct export transactions from the Region by source category (‘wild’ includes source ‘unknown’; ‘captive’ includes sources ‘C’, ‘D’ and ‘F’), 2003-2012. (Numbers of transactions are shown in Figure 3.3.)
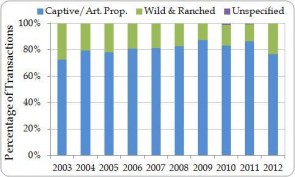
Figure 3.2. Proportion of importer-reported direct export transactions from the Region by source category (‘wild’ includes source ‘unknown’; ‘captive’ includes sources ‘C’, ‘D’ and ‘F’), 2003-2012. (Numbers of transactions are shown in Figure 3.4.)
The proportion of captive-bred/artificially propagated trade transactions has shown a slight increase over time, particularly between 2005 and 2010, while the average proportion of wild-sourced specimens has decreased slightly from 20% over the period 2003-2007 to 16% over the period 2008-2012 according to importer-reported data. According to exporter-reported data, the proportion of transactions reported without a source specified increased from no trade in 2008 to 6% in 2011 and 16% in 2012; this can be primarily attributed to one country in the Region, Honduras, not including source codes for the majority of records in its annual reports for 2010-2012. Numbers of captive-bred/artificially propagated transactions have been variable over the period 2003-2012; wild-sourced transactions have decreased slightly overall, but increased in 2012 according to importer-reported data (Figures 3.3 and 3.4).
By taxonomic group
An analysis of the proportion of trade transactions from different sources by taxonomic group reveals that export transactions of mammal, bird, invertebrate and timber species are primarily wild-sourced, while export transactions of reptile and amphibian species are primarily captive-bred and non-timber plant species are primarily artificially propagated (Figures 3.5.a and 3.5b.). In both mammals and birds, the proportion of captive-bred transactions peaked in 2008 and subsequently declined overall, but increased between 2010 and 2011. The proportion of captive-bred reptile transactions has increased slightly overall, although there was a decrease in both 2011 and 2012 according to importer-reported data.
Exporter- and importer-reported data show slightly different trends in source for amphibians, with exporter-reported data showing an overall increase in the proportion of wild-sourced transactions, but importer-reported data showing a peak in the proportion of wild-sourced transactions in 2008 and a subsequent decline. The considerable discrepancy between exporter- and importer-reported data for amphibians in 2009 is due the fact that the principal exporter of amphibians in the Region, Panama, has not submitted its 2009 CITES annual report; the wild-sourced trade reported by the remaining exporters in that year comprises a small quantity of scientific specimens. Although the vast majority of invertebrate transactions were reported as wild-sourced, exporters reported a small proportion of captive-bred transactions in 2004 and 2010, all comprising Strombus gigas; this is not reflected in the importer-reported data.
While the majority of transactions in non-timber plant species are reportedly artificially propagated, transactions involving timber species were primarily wild-sourced, according to both exporter- and importer-reported data.
The vast majority of the transactions recorded without a source specified involving mammals, invertebrates and plants in 2010-2012 were reported by Honduras (as an importer as well as an exporter, in the case of mammals), while all of the transactions recorded without a source specified involving amphibians in 2006 were reported by Panama, which did not include any source codes in its 2006 annual report.
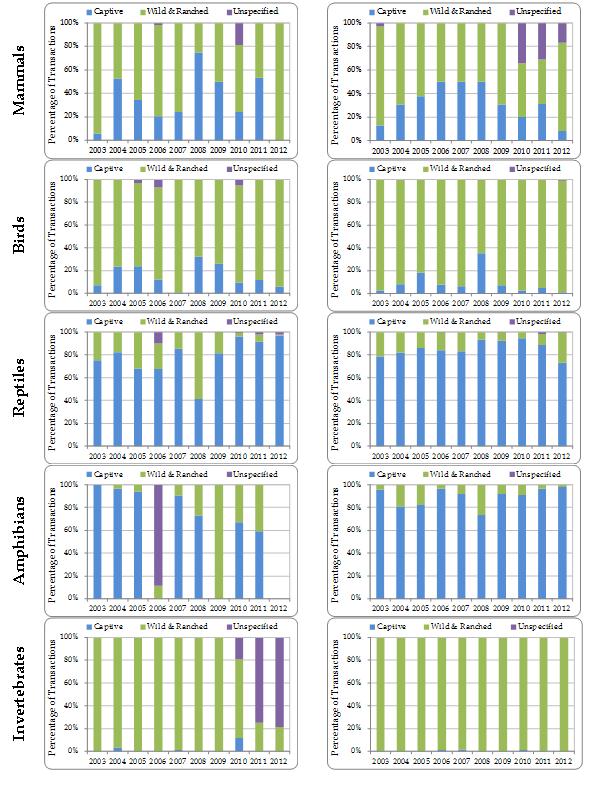
Figure 3.5a. Proportion of exporter-reported (left) and importer-reported (right) direct export transactions from the Region involving animals, by source category (‘wild’ includes source ‘unknown’; ‘captive’ includes sources ‘C’, ‘D’ and ‘F’) and taxonomic group, 2003-2012. Total numbers of exporter/importer-reported transactions, respectively, are as follows: mammals 408/291; birds 793/793; reptiles 5480/5557; amphibians 422/538; invertebrates 620/956.
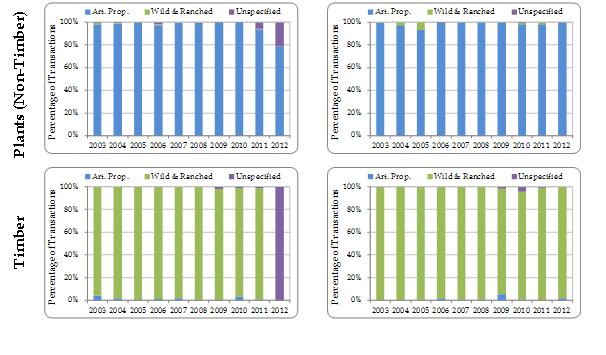
Figure 3.5b. Proportion of exporter-reported (left) and importer-reported (right) direct export transactions from the Region involving plants, by source category (‘wild’ includes source ‘unknown’) and taxonomic group, 2003-2012. Total numbers of exporter/importer-reported transactions, respectively, are as follows: plants (non-timber) 19,189/13,417; timber 2211/1666.
By species
The methodology used to detect shifts in trade source over time within species is described here. Potential shifts were analysed in the context of CITES trade suspensions, as well as negative opinions by the EU Scientific Review Group suspending imports to the EU, that came into effect or were removed during the period 2003-2012.
Based on this methodology, no shifts from one source category to another were identified within any species over time, since the majority of species were traded primarily from one source category. This section will therefore focus on changes in source over time in two species traded at high levels from the Region, for which trade was recorded from both captive and wild sources.
Case study: Strombus gigas (Queen Conch)
Strombus gigas is the species with the highest levels of wild-sourced trade from the Region. The species showed a shift in source over time with wild-sourced trade decreasing over the period 2003-2012 and an increase in trade recorded without a source specified (Figure 3.6). A small quantity of captive-bred meat was reportedly exported in 2004 from the Dominican Republic; no other captive-bred trade was reported between 2005 and 2009. In 2010, a notable quantity of captive-bred meat was reportedly exported by Honduras, comprising almost half (46%) of exports of S. gigas meat from the Region in that year; however, all trade in 2011 and 2012 was reported without a source specified.

Figure 3.6. Exporter-reported direct exports of Strombus gigas meat (kg) from the Region, by source category, 2003-2012.
Case study: Caiman crocodilus fuscus (Brown Spectacled Caiman)
After Iguana iguana, in which trade is reportedly >99% captive-bred, Caiman crocodilus fuscus is the second most highly traded reptile from the Region. The species is primarily traded as skins or skin products from captive sources (reported as source ‘C’), with a small proportion wild-sourced (Figure 3.7). Following a peak in 2005, captive-bred trade declined in every year 2006-2009; wild-sourced trade decreased between 2005 and 2007, but in 2008 and 2009 exceeded captive-bred trade. In both 2010 and 2011, however, captive-bred trade has increased and no wild-sourced trade has been reported.
Shifts in species
To detect overall trends in trade over time in species and shifts in trade from one species to another, species/unit combinations were analysed to determine if an increase or decrease in trade levels could be detected, on the basis of exporter-reported data, using the criteria described here. Again, potential shifts were analysed in the context of trade suspensions in effect at the time, where applicable.
Several of the top species in trade from the Region, when analysed on their own, showed a notable increase or decrease in trade levels over the period 2003-2012. For example, an overall decrease in exports of Swietenia macrophylla timber was identified; this appears to correspond to a sharp increase in trade identified in Cedrela odorata, although the quantities of C. odorata traded were lower and likely reflect the additions of populations to Appendix III in 2008, 2010 and 2011 (Figure 3.8).
The decrease in exports of Swietenia macrophylla may have been influenced by the inclusion of the species in the CITES Review of Significant Trade process in 2008, with the populations of Honduras and Nicaragua, amongst others outside the Region, categorised as ‘Possible Concern’; both countries were removed from the Review in 2012 (SC63 Doc. 14). However, exports from Nicaragua decreased every year from 2006 onwards, while exports from Guatemala, which was excluded from the Review, also decreased from 2008 onwards, suggesting that other factors were more important in influencing trade levels.
The decrease in trade in Strombus gigas meat shown in Figure 3.6 can be attributed to the introduction of a suspension of trade in the species from Honduras and the Dominican Republic in 2003 as a result of the Review of Significant Trade process; the suspensions were removed in 2006 subject to quota (CITES Notification No. 2006/034). These suspensions also coincided with an increase in exports of the species from Nicaragua (Figure 3.9); Nicaragua’s annual reports to CITES for 2010 onwards have not yet been received.
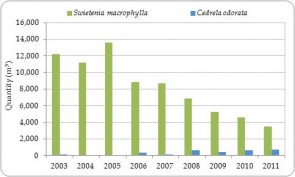
Figure 3.8. Exporter-reported direct exports of Swietenia macrophylla and Cedrela odorata timber (m3; including plywood and veneer) from the Region, all sources, 2003-2011 (no trade was reported in 2012).
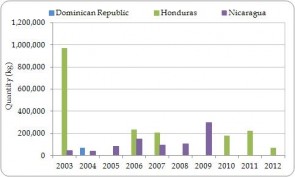
Figure 3.9. Exporter-reported direct exports of Strombus gigas meat (kg) from the Region by exporting country, all sources, 2003-2012.
Decreases in trade levels were also observed in live Iguana iguana (Figure 3.10); no corresponding increases in trade in related species were identified.
By contrast, trade in Cycas revoluta derivates, including leaves, stems and roots, has shown a gradual increase over the period 2003-2012 (Figure 3.11). While no overall trend in trade in live C. revoluta is apparent, the trend is difficult to interpret since large quantities of plants were recorded in trade by weight between 2009 and 2011, totalling over 1.9 million kilograms. Again, no corresponding trends in trade in related species were identified.
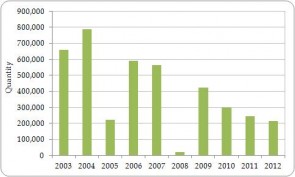
Figure 3.10. Exporter-reported direct exports of live Iguana iguana from the Region, all sources, 2003-2012.
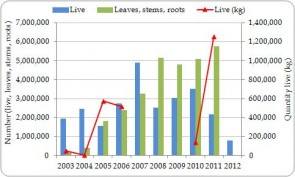
Figure 3.11. Exporter-reported direct exports of Cycas revoluta live plants and derivatives from the Region, all sources, 2003-2012.
In several cases, a notable decrease in trade levels over time was observed at the family level or above. For example, trade in live palms (Palmae) decreased from 128,241 plants exported in 2005 to less than 50 plants exported in every year 2009-2011 (Figure 3.12).
Trade in live parrots (Psittaciformes) decreased from 3128 birds exported in 2003 to 11 birds in 2011 (Figure 3.13), with the most notable decline in 2006, correlating with the introduction of European Union animal health restrictions on commercial trade in wild birds in 2005.
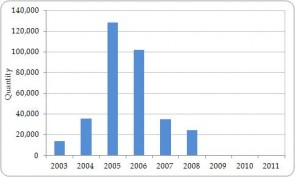
Figure 3.12. Exporter-reported direct exports of live palms (Palmae) from the Region, all sources, 2003-2011 (no trade was reported in 2012).
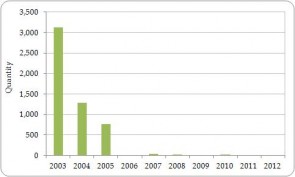
Figure 3.13. Exporter-reported direct exports of live parrots (Psittaciformes) from the Region, all sources, 2003-2012.
Based on the criteria for sharp increase or decrease in trade, a number of potential shifts between closely related species were identified, particularly amongst plants. For example, the top species in trade within the cycad family Zamiaceae, Zamia furfuracea, showed a decrease in trade 2003-2011 overall, whilst trade in Z. integrifolia increased between 2006 and 2009, with trade levels in both 2009 and 2010 exceeding those of Z. furfuracea (Figure 3.14). According to importer-reported data, the principal importers of both species were the United States and the Netherlands, with exports of Z. furfuracea to both countries showing a notable decrease in 2008 and 2009 and exports of Z. integrifolia to both countries increasing over the period 2007-2009.
One potential driver of shifts in trade between closely related species is the introduction of a trade suspension. The formation of a negative opinion by the EU Scientific Review Group for artificially propagated, live Tillandsia xerographica from Guatemala (the most highly traded species of its family from the country) on 3/12/2010[1], for instance, coincided with a decrease in trade in this species and a corresponding increase in trade in Tillandsia harrisii (Figure 3.15). Guatemala was the only country in the Region to report direct exports of either species over the period 2003-2012.
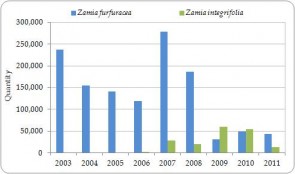
Figure 3.14. Exporter-reported direct exports of live Zamia furfuracea and Z. integrifolia from the Region, all sources, 2003-2011 (no trade was reported in 2012).
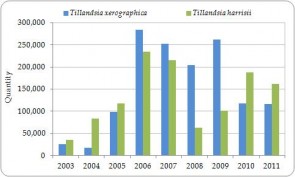
Figure 3.15. Exporter-reported direct exports of live, artificially propagated Tillandsia xerographica and T. harrisii from Guatemala, 2003-2011 (Guatemala’s CITES annual report for 2012 has not yet been received).
[1]54th Meeting of the EU Scientific Review Group.
Conclusions
Overall, no major shifts in source over time were identified, either across all taxa or within individual taxonomic groups or species; the majority of species in trade primarily originate from a single source. Amongst a number of species, notable shifts in trade volumes and apparent shifts between taxa were detected. Several of the top species in trade from the Region, in particular Iguana iguana, Strombus gigas and Swietenia macrophylla, showed a gradual decrease in trade over time, while trade in others, such as Cycas revoluta, appears to have increased.

![Figure 3.7. Exporter-reported direct exports of Caiman crocodilus fuscus skins, skin pieces and leather products from the Region, by source category (‘wild’ includes source unspecified [<1%]), 2003-2011 (no trade was reported in 2012).](http://citescentroamerica.unep-wcmc.org/wordpress/english/wp-content/uploads/sites/3/2014/02/Fig-3.7..jpg)